Monitoring with Grafana
Execute the following command to open the Kiali UI:
istioctl dashboard grafanaMesh overview: In the Grafana dashboard, click Home → Istio → Istio Mesh dashboard:
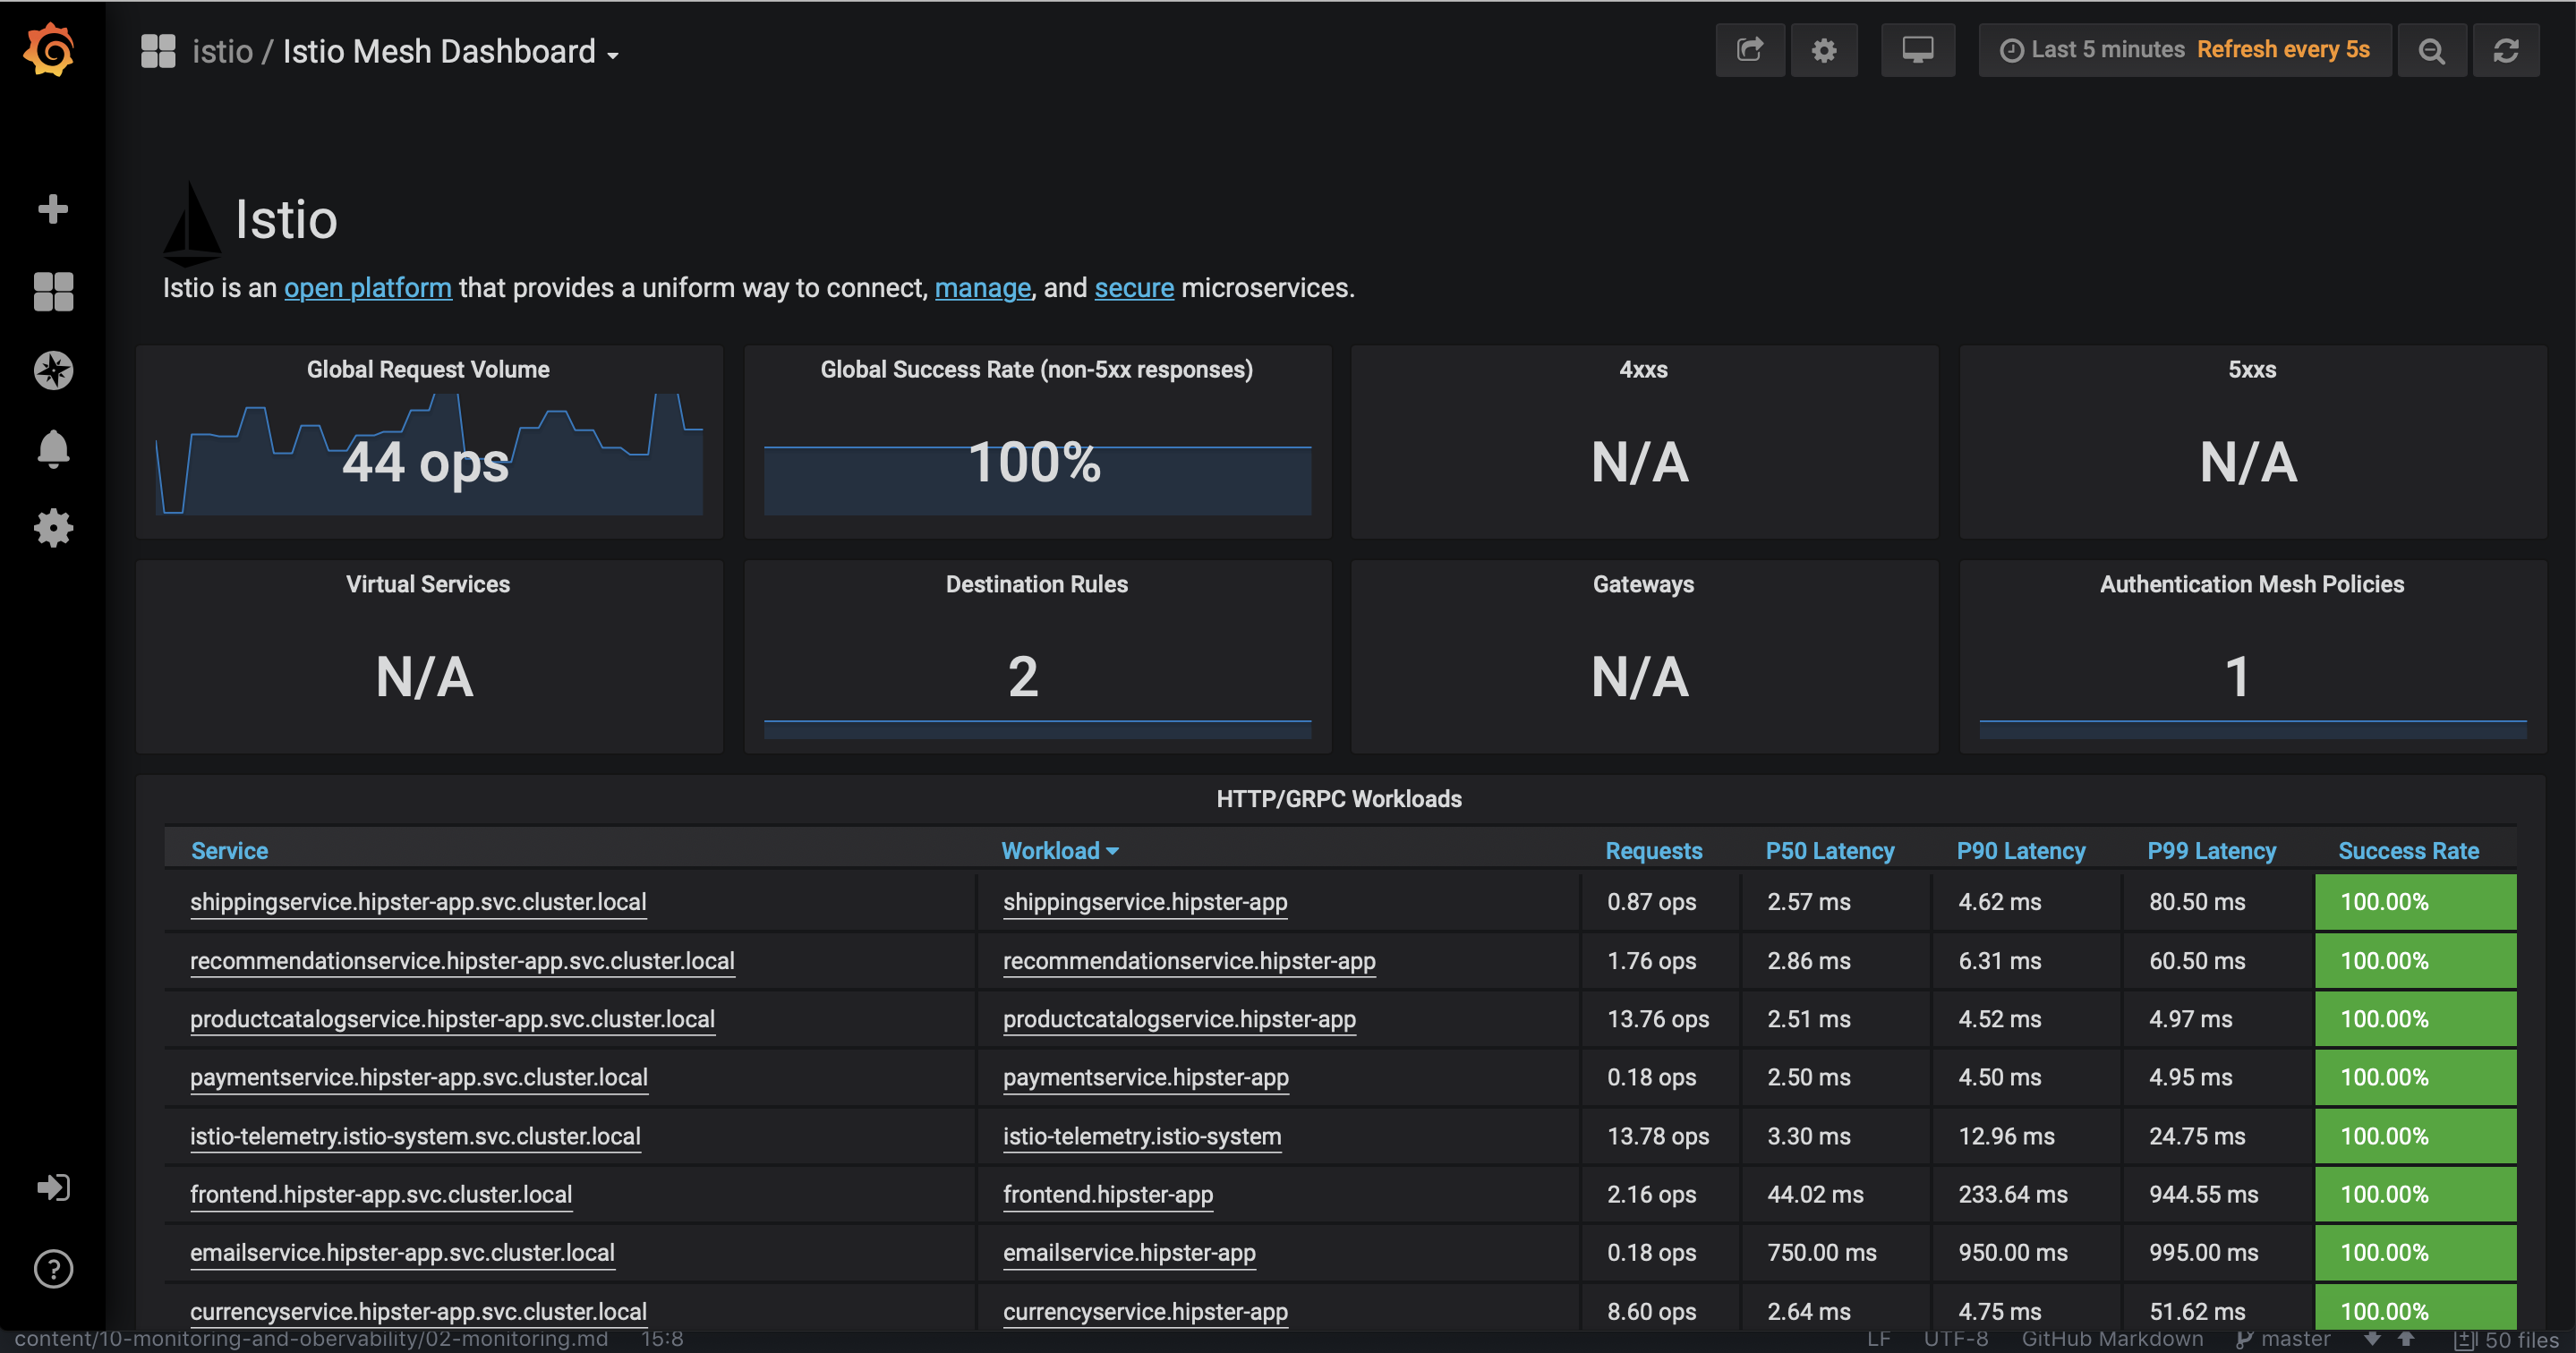
This gives the global view of the Mesh along with services and workloads in the mesh.
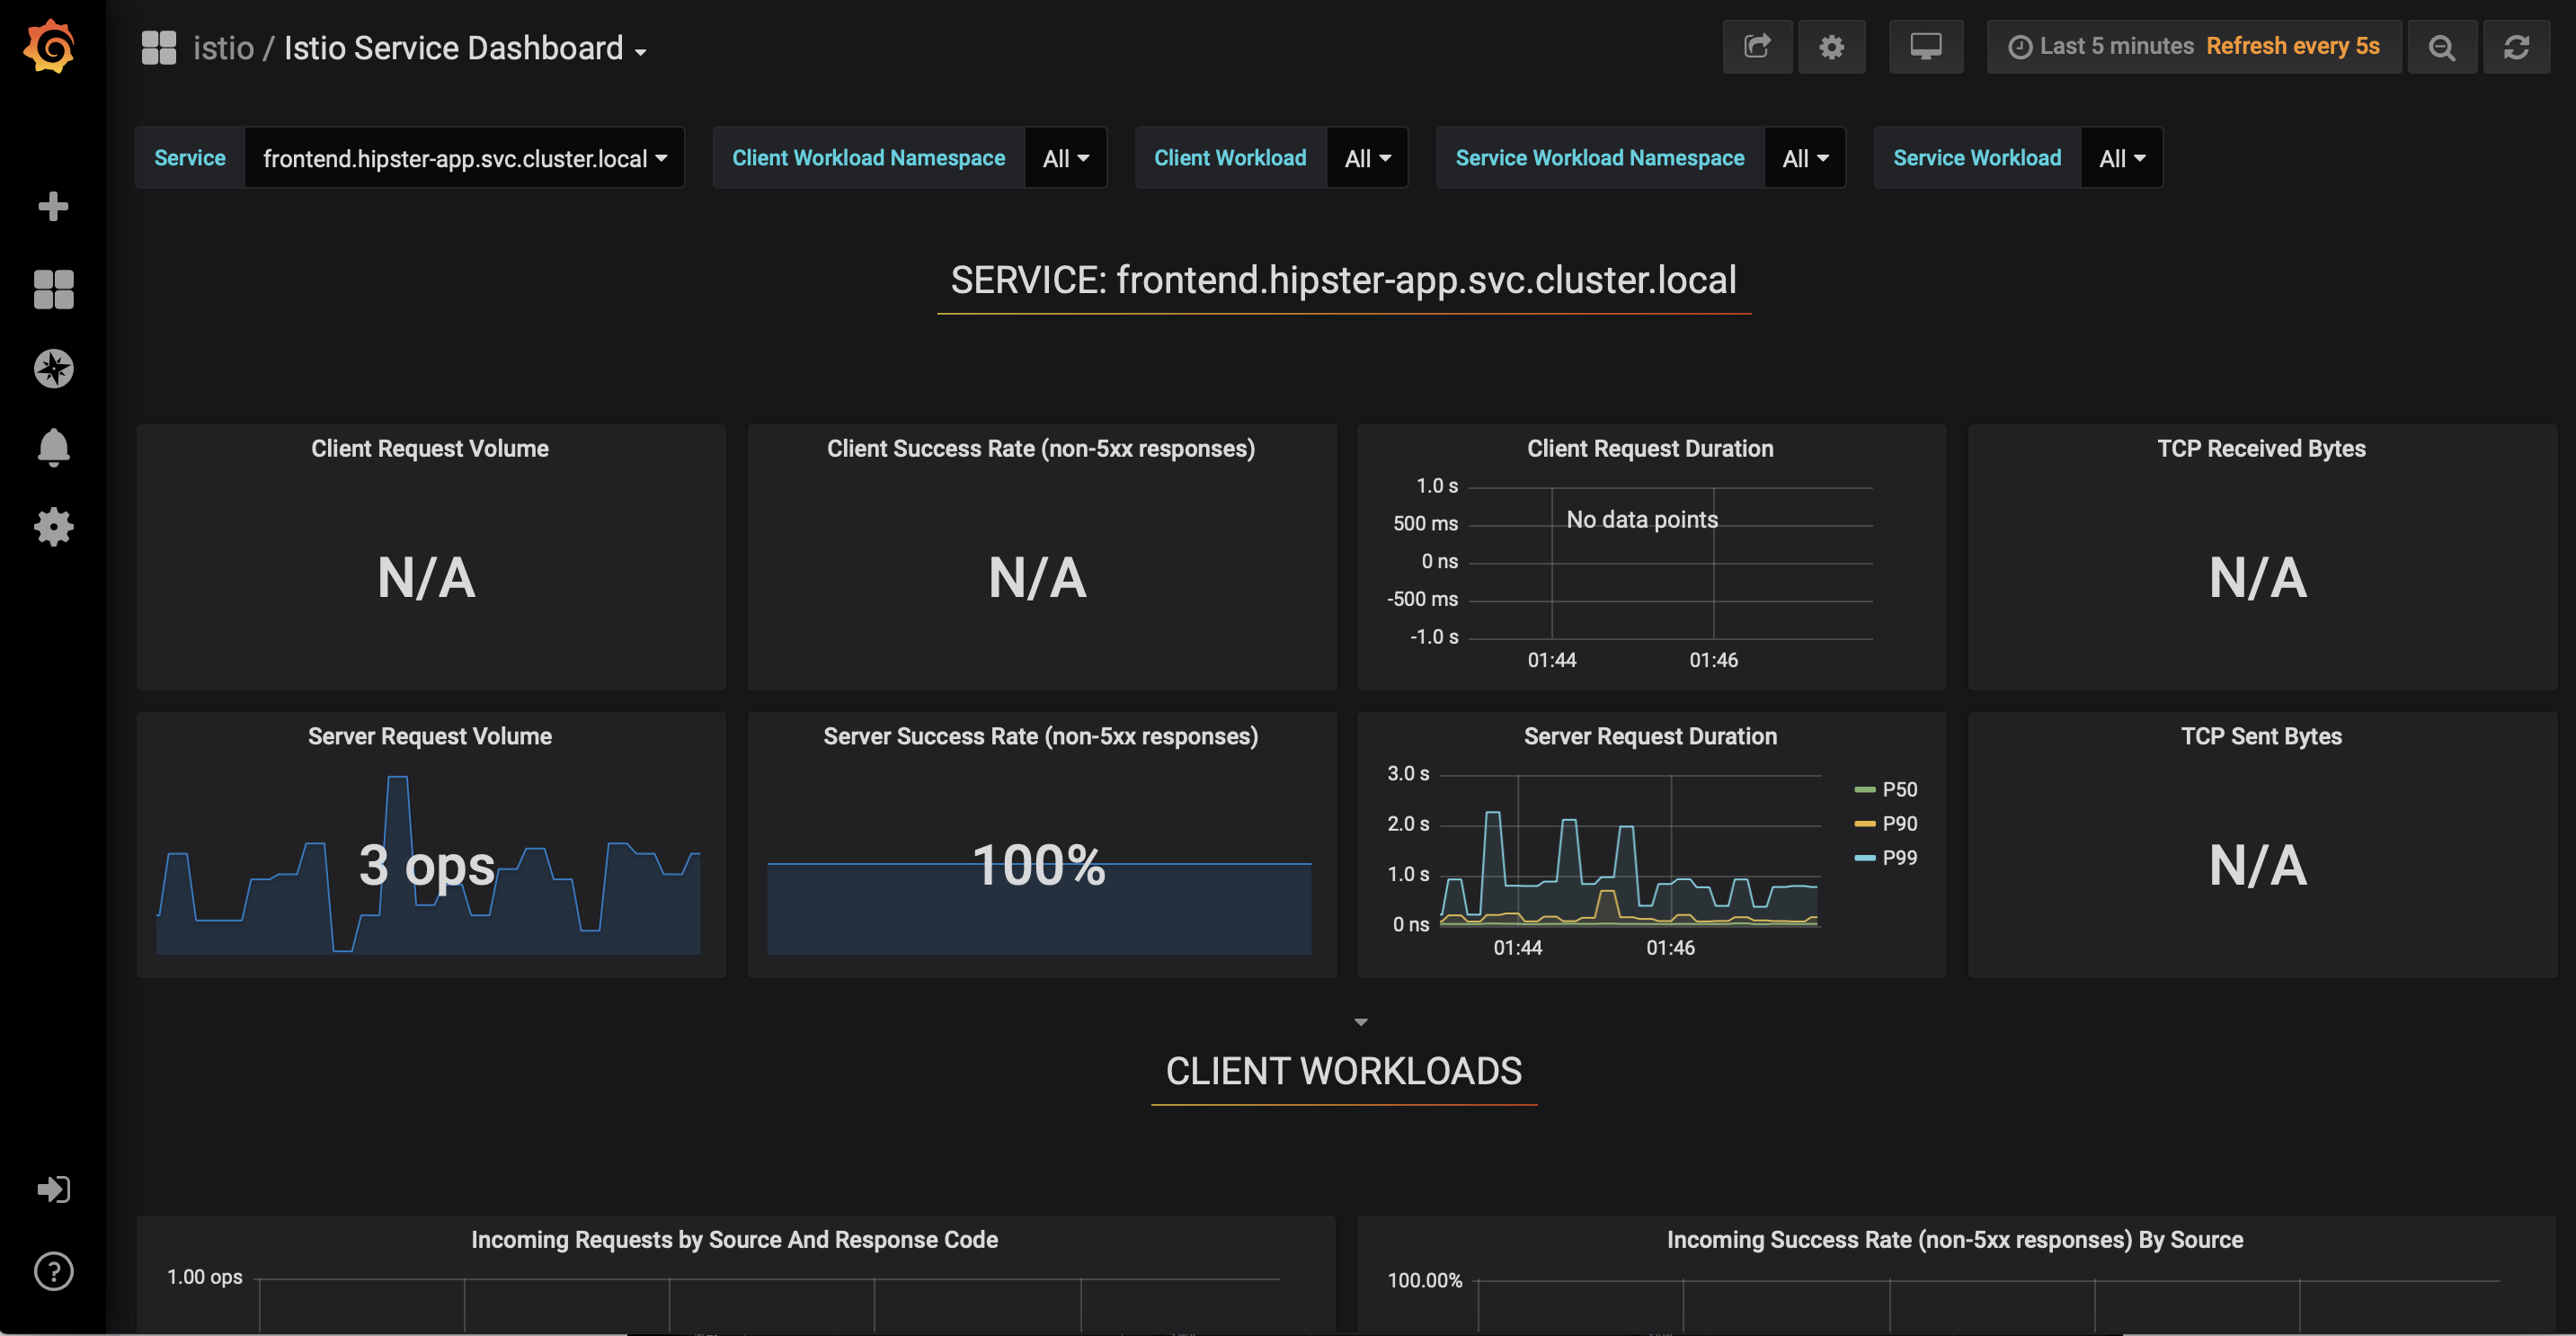
- Service Dashboard: