Prometheus
Use
istioctl dashboardcommand line to Establish a secure tunnel to the Prometheus pod::istioctl dashboard prometheusThe Prometheus UI will be opened in your default web browser:
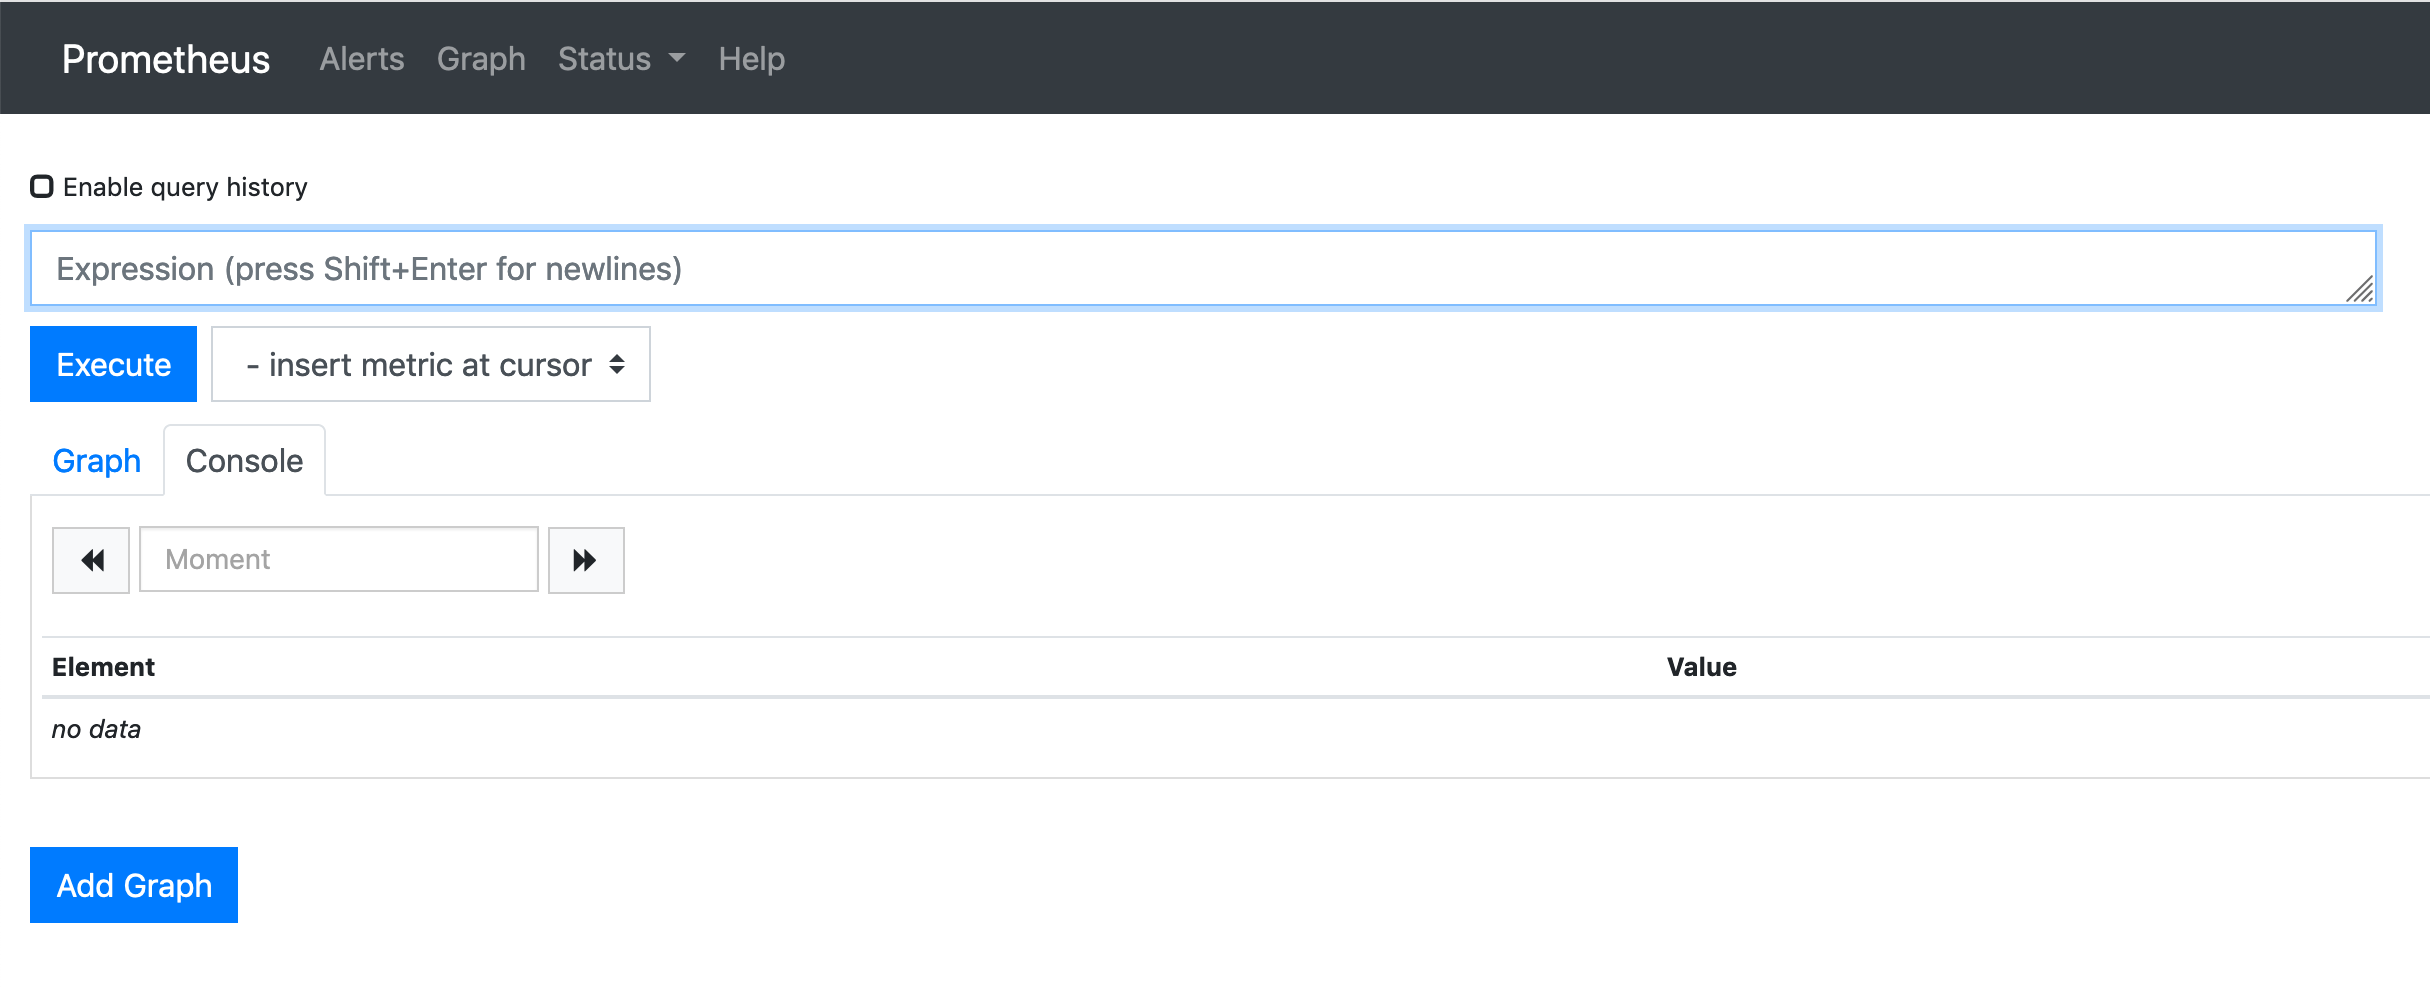
Choose the api server request count then click execute:
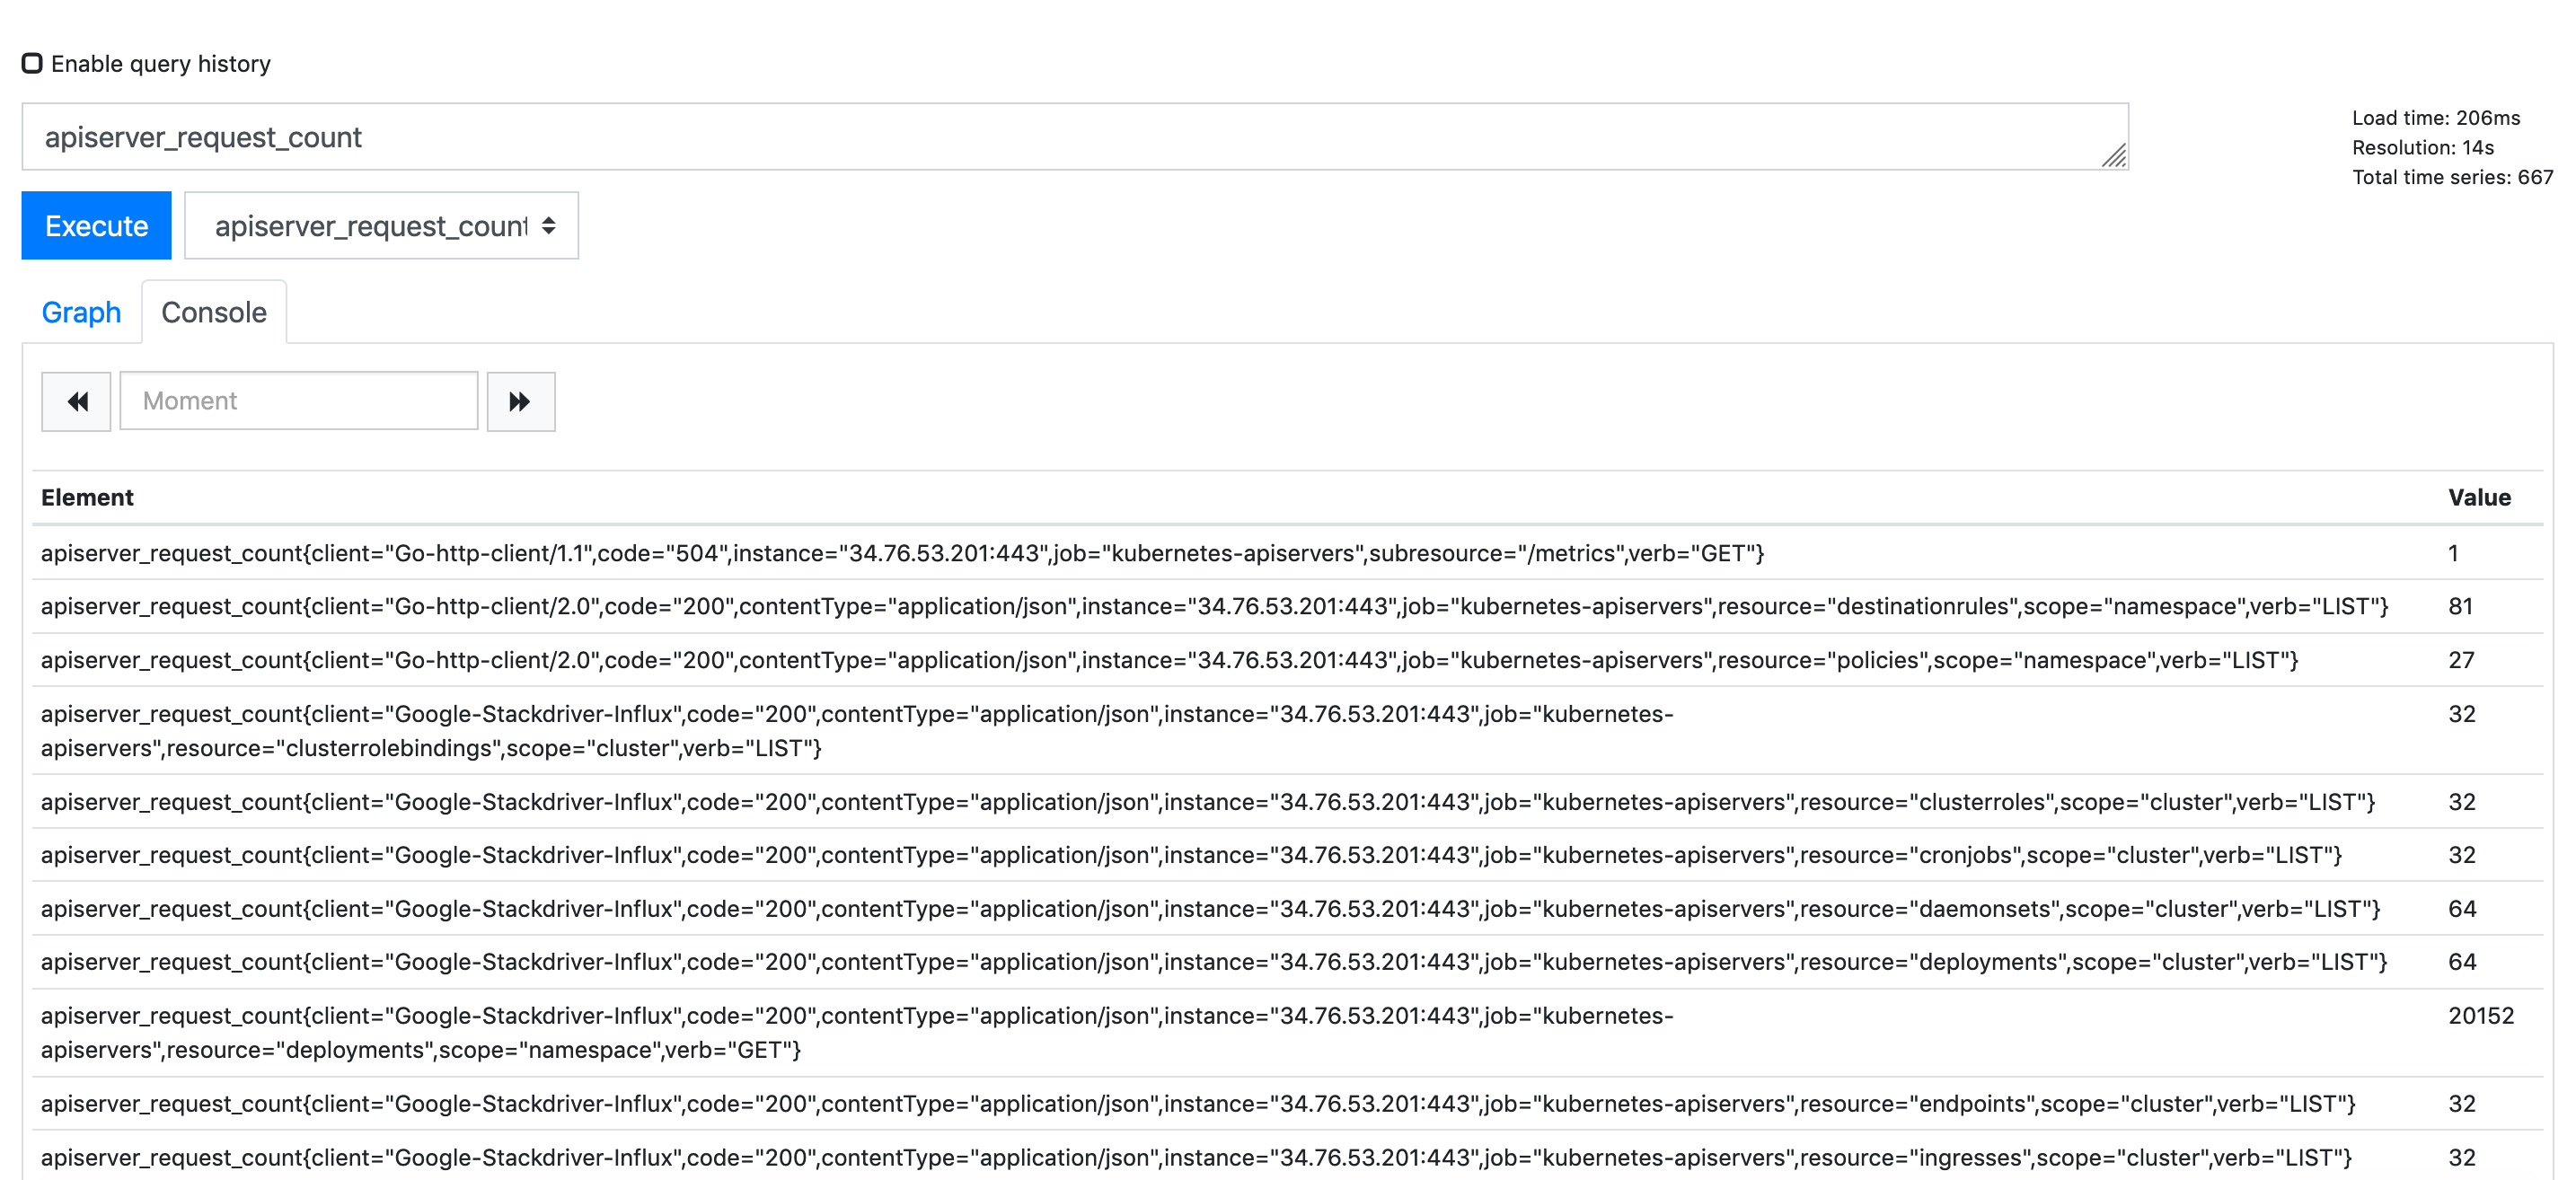 The number of request to the api server is displayed for each requester.