Grafana
Use
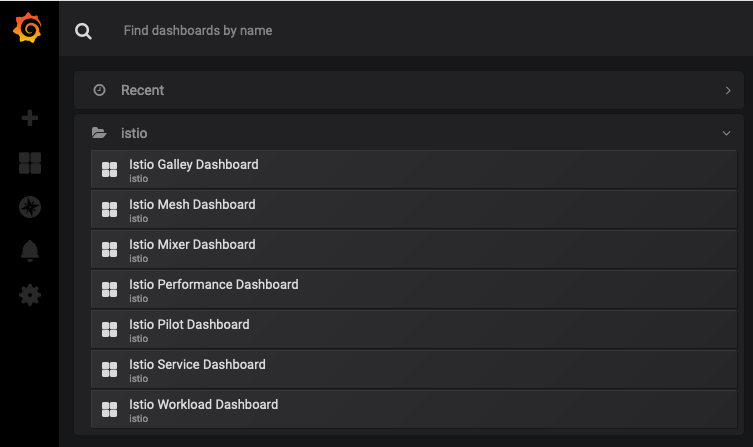
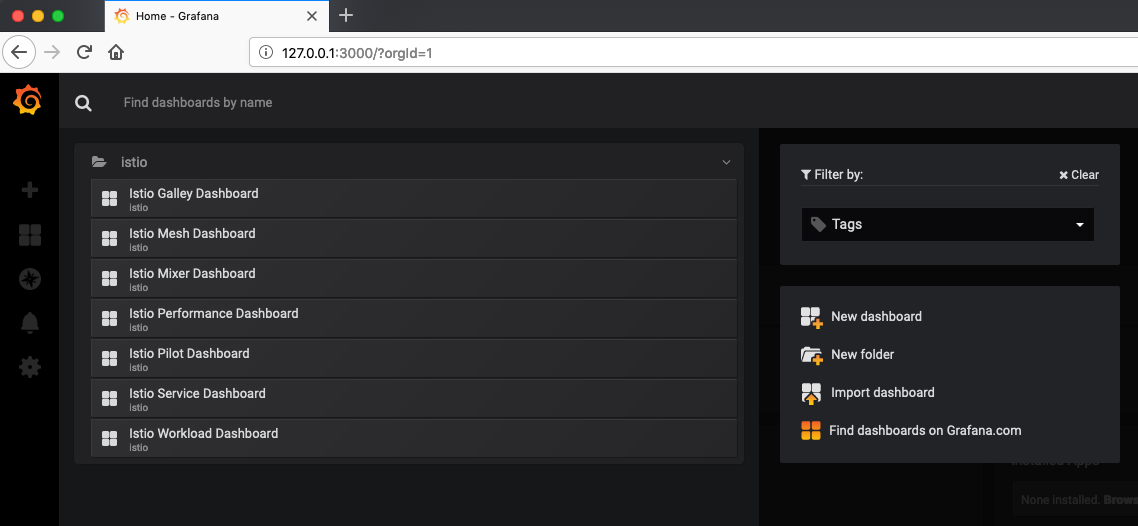
istioctl dashboardcommand line to establish a secure tunnel to the Grafana pod:istioctl dashboard grafanaIn the Grafana Dashboard, click Home → Istio:
Istio comes with 6 default dashboards, you can add you owns or customise the existing ones:
- Click Home → Istio → Istio Performance Dashboard:
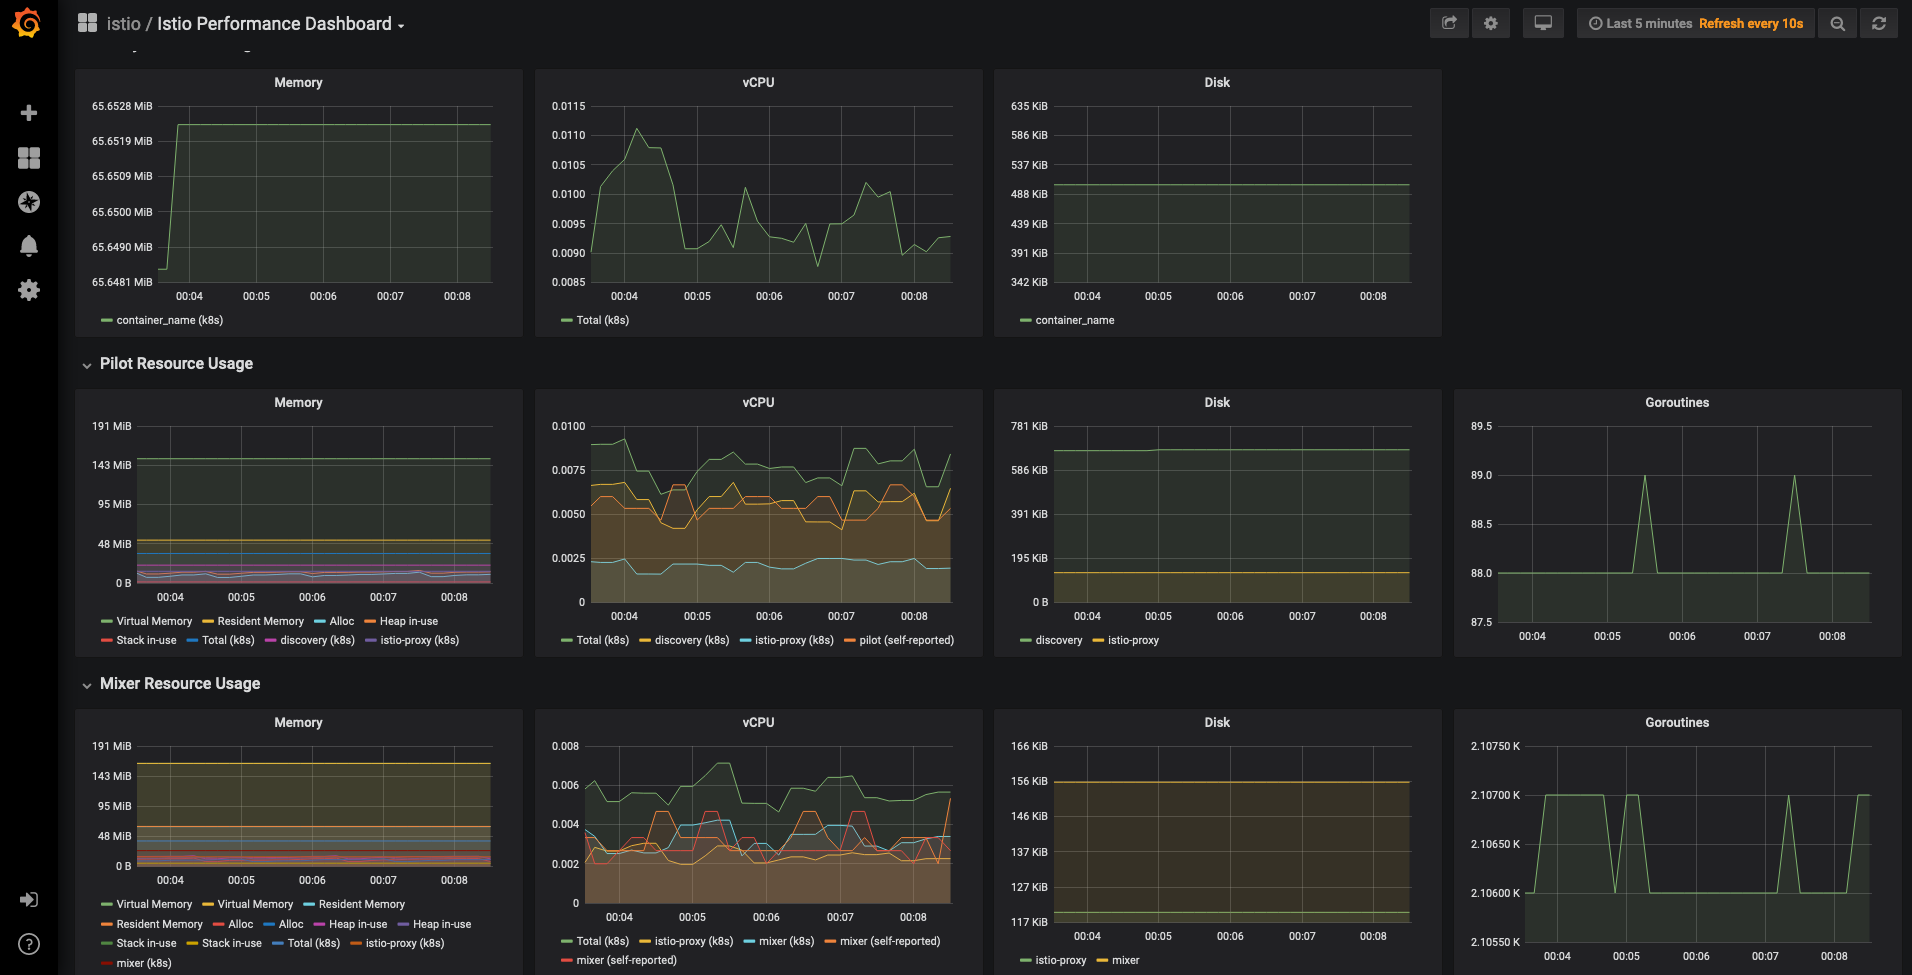
The dashboard shows Istio core components performance and resource utilization. We will use it later the others dashboard within the deployed application.